
Macroeconomic situation
EU's economic situation in 2019
Economic growth in the entire European Union reached 1.4% GDP in 2019, and 1.1% in the eurozone. Nearly all EU countries slowed down, although at different paces. In Germany, GDP growth was just 0.6%, the lowest in six years. The weaker German economy is related to a considerable slowdown in exports, which went up by just 0.9% from the preceding year, while imports grew by 1.9%.
The German economy felt the effects of the trade disputes between the U.S. and China as well as the consequences of lower interest in German cars on foreign markets - the number of vehicles produced by the three largest car-makers (Volkswagen AG, BMW AG and Daimler AG) went down by 9% in 2019.
Low GDP growth was also recorded in Italy, at just 0.1%. The French economy fared slightly better - 1.3%, as did the Spanish economy - 1.9%. Poland's GDP went up by 4.0%.
Poland's economic situation in 2019
For Poland, 2019 was a period of slower economic activity - according to Statistics Poland, GDP growth declined to 4.0 from 5.1% in 2018. The economy was supported by private consumption, low unemployment and wage growth. In real terms, wages declined because of the quickly rising prices.
The Polish economy's strong dependence on and close links to the European Union - which in turn depends on global markets - were noticeable last year. The past 12 months were a difficult time for our key trading partner - Germany. Aside from this, the European Union was still preparing for Brexit. On the other hand, the U.S.-China "trade war" also had a considerable impact as it led to new customs duties and barriers, which had a negative impact on business confidence. This was best shown by the declines in PMIs for the European Union.
The first half of 2019 saw a huge upturn thanks to stronger investments. This translated into higher demand for new jobs. However, in subsequent months external threats grew stronger, which was reflected in the shape of the Polish economy, which eventually led to a cooling-off and lower GDP growth. Estimates show that in Q4 2019 the economy went up by 2.9%, as compared to Q4 2018, the lowest growth figure in three years. The decline versus Q3 2019, when GDP growth was 3.9%, also surprised the economists.
For Jastrzębska Spółka Węglowa, the most important areas of the macroeconomic environment are those that can have material impact on the Group's further development, i.e. coal, coke and steel markets.
Coal, coke and steel markets
Steel
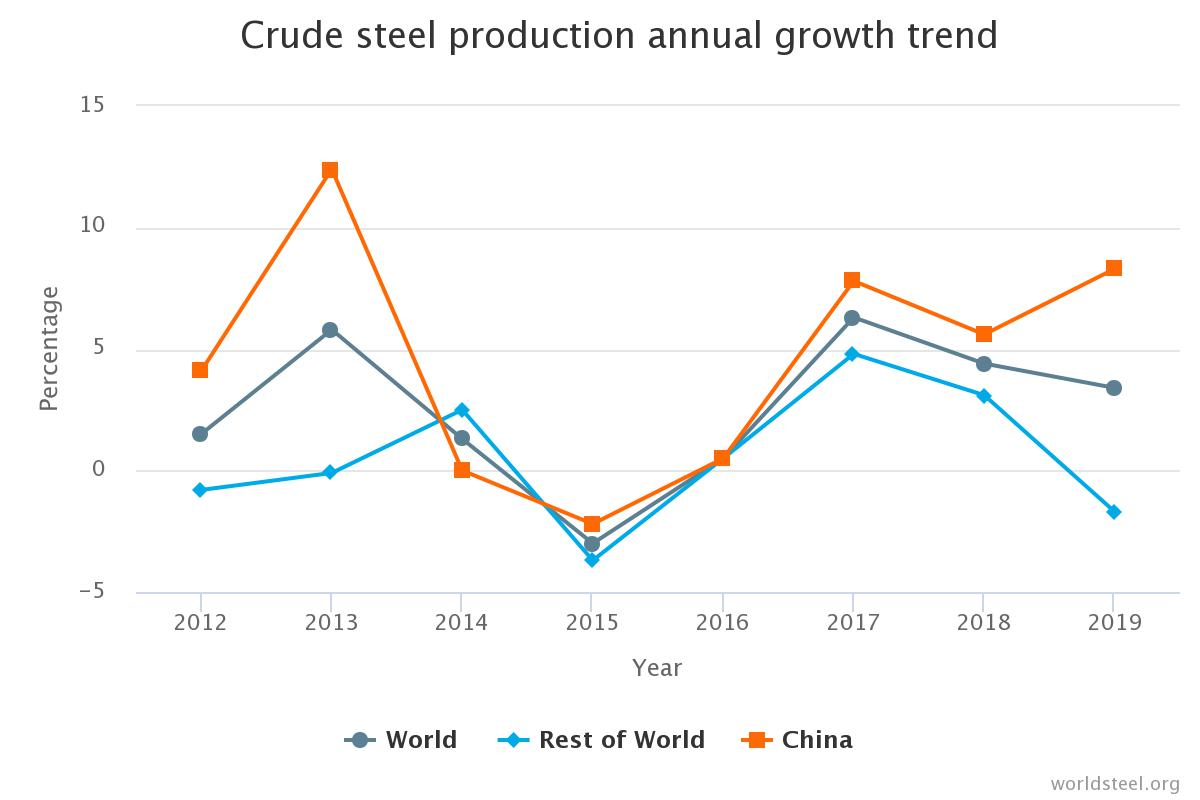
The global production of crude steel in 2019 went up by 3.4% to 1 869.9 Mt (up by 61.3 Mt). The largest growth was recorded in Asia (+5.7%), which produced 1 341.6 Mt. China alone produced 996.3 Mt (+8.3%), raising its share in global crude steel output from 50.9% in 2018 to 53.3% in 2019. India came in second (111.2 Mt, +1.8%), followed by Japan (99.3 Mt, -4.8%) and Korea (71.4 Mt, -1.4%).
Steel production in the EU reached 159.4 Mt, down by 4.9% from 2018, when it had reached 168.1 Mt. On a country level, in 2019 Germany produced 39.7 Mt of crude steel (-6.5%), Italy 23.2 Mt (-5.2%), France 14.5 Mt (-6.1%), Spain 13.6 Mt (-5.2%) and Poland 9.1 Mt (-10.9%).
Crude steel production in North America reached 120.0 Mt in 2019 (-0.8%), with the U.S. producing 87.9 Mt of crude steel (+1.5%).
Chart. Crude steel production annual growth trend
Eurofer estimates that domestic production and import, without export, in the EU declined in 2019 to 158 Mt, by 3.1% from 2018, while steel imports to the EU were lower than in 2018.
In 2020, Arcelor Mittal expects global steel consumption to increase by 1-2%, compared to 1.1% in 2019. The company explains the difficult situation on the global market with a major surplus of production capacities - over 400 Mt. Demand for steel in Europe is falling, which is mainly due to market uncertainty as well as trade and geopolitical tensions having a negative impact on the level of investments and trade. As previously announced, ArcelorMittal is supposed to re-start its blast furnace and steel-making facility in Kraków as soon as market conditions improve enough to make the start-up economically viable.
In the nearest future, steel output will be driven by threats related to a global economic slowdown and a decline in industrial activity. Despite the fact that after signing the U.S.-China agreement on 15 January 2020 global trade tensions declined, the EU's manufacturing sector remains under pressure. Uncertainty as to the eventual shape of Brexit and the condition of the EU's industry can contribute to a further deterioration in business sentiment and reduced activity in steel-consuming industries. According to forecasts, production in steel-consuming sectors in the EU will slightly increase over the next two years, by 0.6% in 2020 and by 1.4% in 2021.
Coal
The world is using about 1.2 billion tonnes of metallurgical coal (HCC, semi-soft, PCI) annually. Asia is the main consumer, with an 80% share. EU countries account for approx. 6% of global coal use.
Demand for coking coals in the European Union is estimated at approx. 54 Mt, of which approx. 40 Mt is imported. The current consumption of coking coals in the EU is far from the more than 80 Mt recorded in 2008, which is tied to the level of steel and coke production.
CRU International estimates that over the next five years global trade in coking coals will rise from 346 Mt in 2018 to 384 Mt in 2024. The list of the largest suppliers of this commodity to the global market remains the same, with Australia accounting for over 50%. The key suppliers remain Canada and Russia, although the U.S.'s share is expected to fall.
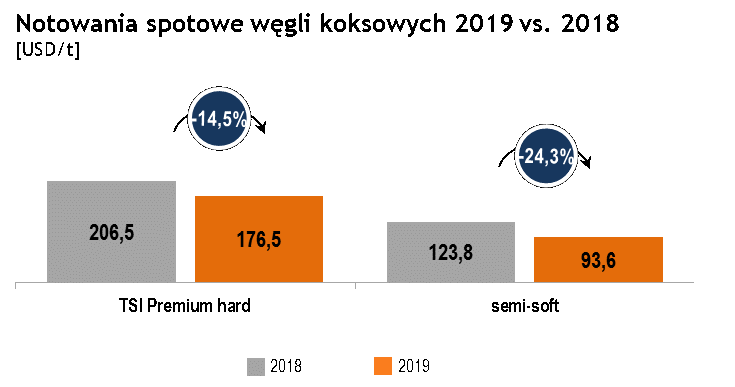
No unpredictable one-off events were recorded in 2019, such as those having major impact on the prices of coking coal in previous years. The TSI Premium HCC index prices in H1 2019 were stable, with the average price for Q1 2019 reaching 206.6 USD/t and 202.6 USD/t in Q2. In the year's second half, coking coal prices systematically decreased. The average price for the TSI Premium HCC index in Q3 2019 was 160.1 USD/t and 139.4 USD/t in Q4. These declines meant that the average daily price for the TSI Premium HCC index in full-year 2019 was 176.5 USD/t and was 14.5% lower than in the preceding year. Semi-soft coals recorded stronger declines than hard premium coals. The average annual price in 2019 was 24.3% lower than a year earlier.
Chart. Spot prices of coking coals 2019 vs. 2018
The declines in coking coal prices in H2 2019 resulted from lower demand for coal in maritime trade, given a lack of supply restrictions. The decline in demand during this period was driven by: reductions in coking coal purchases by China - having reached the annual import limit sooner, lower than expected demand from India and reductions in steel production in Europe.
The average prices for coking coal sold by JSW Group to external customers, converted into USD using the average exchange rate published by the National Bank of Poland for a given quarter, in relation to the TSI index and a benchmark price calculated using Nippon Steel's methodology are shown in the following diagrams.
Chart. TSI Premium Hard
Relationship of average quarterly prices: JSW / index average 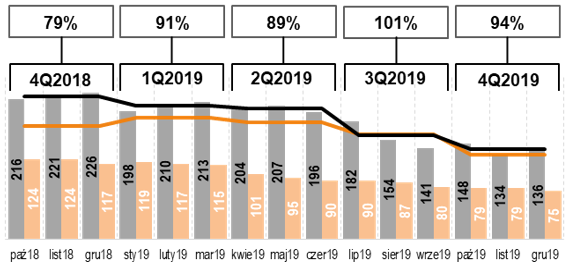
Chart. Reference price according to the Nippon Steel method
Relationship of average quarterly prices: JSW/Nippon Steel 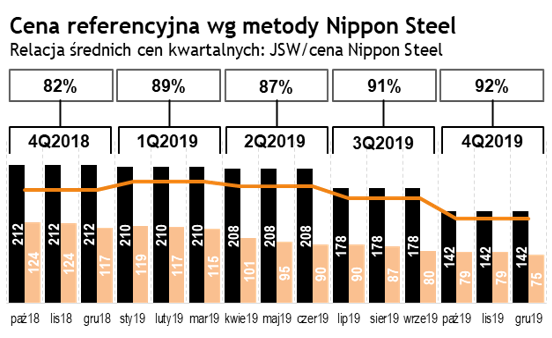
Source: Platts, JSW's data
Coke
Similar to coking coal, the coke market is global. Demand for coke largely depends on the level of steel production in the basic oxygen furnace process (BOF), which currently accounts for approx. 72% of global steel production, and changes in the technological processes of steelmaking.
Coke production peaked in 2014 at 688 Mt. Over the past five years, global coke production recorded 2.2% declines annually. This was mainly caused by lower production in blast furnaces as well as environmental protection requirements for the coal and coke industry. The situation in various parts of the world is different, just as in the case of steelmaking.
Global coke trade in 2019 reached 23.3 Mt, a 15% decline from the preceding year. Coke exports from China in 2019 reached 6.5 Mt, down by 33% from the previous year. The decline in coke exports from China is due to its loss of pricing competitiveness in comparison with other sources of this commodity.
Coke production in Poland in 2019 reached 8.6 Mt and was 5.9% lower than in 2018. With an output of 3.2 Mt, JSW Group accounted for 37% of domestic coke production during that period. In Europe, coke is mainly produced at coking plants integrated with steelmaking facilities, and JSW Group is the largest non-integrated producer in the region. JSW Group's share in global coke exports is approx. 10%.
According to CRU International, global coke consumption will largely remain unchanged in the mid-term, with an annual growth rate of 0.4% over the next five years.