
Macroeconomic environment
Global economic situation in 2020
The U.S. economy shrunk by 3.5% in 2020, when COVID-19 caused the worst economy freeze since the end of WW2. China's economy in turn grew more than expected, despite the rest of the world being heavily affected by the COVID-19 pandemic. According to government statistics, the world's second-largest economy grew by 2.3% in 2020, in comparison with the previous year. This is the lowest GDP growth rate recorded in China for decades - since 1976, when GDP grew by 1.6%.
According to data published by the European Commission, GDP decline in the European Union reached -6.3% in 2020 (and -6.8% for eurozone countries). Nearly all countries in this group went through a recession, although on varying scales. Ireland was the only country to post GDP growth (3.0%). According to EC data, the smallest declines were recorded in Lithuania (-0.9%) and Poland (-2.8%). Estonia and Sweden also recorded GDP declines of less than 3% in 2020 (-2.9% in both of the cases). The 2020 recession hit Greece and Spain the hardest, with GDP declining by 10% and 11%, respectively. Germany's GDP went down by 5.0%, without accounting for seasonal factors. The German economy’s weaker performance was related to a visible slowdown in exports, which declined by 9.3% last year. This was the first decline since 2013 and the largest fall since 2009, when it had reached 18.4% following the global crisis. The German economy felt the effects of the COVID-19 pandemic and the lockdowns introduced by key trading partners, which resulted in lower interest in German cars (according to ACEA data, the volume of cars sold declined by 19.1% in 2020). The Europe-wide passenger vehicle market shrunk by 23.7% to 9.9 million units (from 13 million in 2019).
Economic situation in Poland in 2020
Data published by the European Commission shows that the recession Poland experienced in 2020 was one of the mildest in the European Union, reaching just -2.8%, compared to -6.3% for the entire EU. The decline in economic activity in Poland in 2020 is also confirmed by preliminary data from Statistics Poland, which shows that the economy shrunk by 2.8% in real terms, compared to 4.5% growth in 2019. The economic situation and GDP last year were significantly influenced by pandemic restrictions that led to declines in consumption (-3.0%) and investments (-8.4%).
To obtain a fuller picture of Poland's economy in 2020, the first half of the year was a time of a major slowdown caused by the lockdown, followed by a recovery in the second half. Lifting some of the restrictions caused real GDP to grow in the third quarter by 7.9% q/q, mainly due to a major revival in household consumption and growth in exports, which improved the trade balance. Economies - not just the domestic one - were supported with massive fiscal packages and adapted to administrative restrictions. According to economists, Poland's GDP in 2021 will recover the losses caused by the pandemic, and this will be driven by reaching "herd immunity," and thanks to the "unfreezing" of the economy investments, an important component of GDP, are slated to recover. The European Commission forecasts that Poland's GDP will grow by 3.1% in 2021 and by 5.1% in 2022.
The Polish economy's strong dependence on and close links to the European Union - which in turn depends on global markets - will remain the key factors driving the direction and pace of growth of the national economy. According to EC estimates, the GDP of EU member states will grow by 3.7% in 2021 and 3.9% in 2022.
For Jastrzębska Spółka Węglowa, of key significance are those areas of the economic environment that can substantially influence the Group's further development, i.e. the metallurgical coal, coke and steel markets.
Steel,coal and coke market
Steel market
After a tough 2019, when the steel sector in Europe had recorded deteriorating financial results and faced complex geopolitical, economic and environmental problems, 2020 failed to deliver the expected improvement. Economic activity and production levels in the steel sector were determined by restrictions related to the pandemic. COVID-19 lockdowns placed major limitations on steel production around the world, although this was unevenly distributed in terms of geography and timing. The regions that were the most affected by blast furnace stoppages were Europe and North America, where the re-start of halted steel production capacities was slower than in other parts of the world. The pace of recovery in China after the COVID-19 restrictions were lifted has exceeded expectations. Strong demand in construction and infrastructure - supported by government stimulus - and high margins encouraged steelmakers to ramp up production, surpassing the previous year's levels and setting further records. Steel production in Europe revived in the second half of 2020. In mid-2020, approx. 18 blast furnaces were halted in Europe, with a total production capacity of approx. 30 mt. By the year-end, most of the blast furnaces were put back into service or were expected to be re-started.
World crude steel production in 2020 reached 1.65 billion tonnes, a 0.9% decline from the preceding year. The few increases in output were mainly recorded in Asian countries (up by 1.5% from 2019), where steel production reached 1.37 billion tonnes. In China alone, 1.05 billion tonnes of crude steel was produced, up by 5.2% from the previous year. Crude steel production in China accounted for approx. 56% of global output, compared with 53% in 2019. India produced 99.57 mt of steel last year, down by 10.6% y/y. Japan produced 83.19 mt of steel, a 16.2% decline from 2019. Turkey, Vietnam, Pakistan and Thailand recorded output growth.
European steelworks produced 138.8 mt of steel in 2020, an 11.8% decline from the preceding year. The region's largest steelmaker - Germany - produced 35.7 mt, 10% less than in the preceding year. Italy, the second largest steelmaker in the region, produced 20.2 mt, a 12.9% decline y/y. France produced 11.6 mt (down by 19.8% y/y) and Spain produced 10.9 mt (down by 19.5% y/y). Crude steel production in Poland declined in 2020 in line with the European average to 7.9 mt. Most of the EU countries recorded declines in crude steel production in 2020, except for Czech Republic, Finland and Greece, which posted modest increases.
Eurofer estimates that apparent steel consumption in the EU declined in 2020 by 14.6% y/y to 131 mt. In steel-using sectors, automotive suffered the most due to the COVID-19 pandemic, while the construction sector remained relatively stable. These two sectors account for more than 50% of steel consumption in the EU. The number of new cars registered in the EU declined at a record pace in 2020, i.e. by 23.7% to 9.9 million units, which according to ACEA was a direct effect of the pandemic. This is the largest decline in new car registrations since the start of this statistic. Double-digit declines were recorded across all major EU car markets. Germany suffered the least as it saw a 19.1% decrease. The decline in registrations is slightly lower than the 25% expected in ACEA's earlier forecasts.
The prices of basic steel products on the European market declined during the most severe restrictions in economic activity in the second quarter of 2020, after which they grew in the third and fourth quarter of 2020, driven by higher demand from steel-using sectors (e.g. automotive).
Steel production and prices of steel products in EU (USD/t)
Chart. Steel production [million tons]
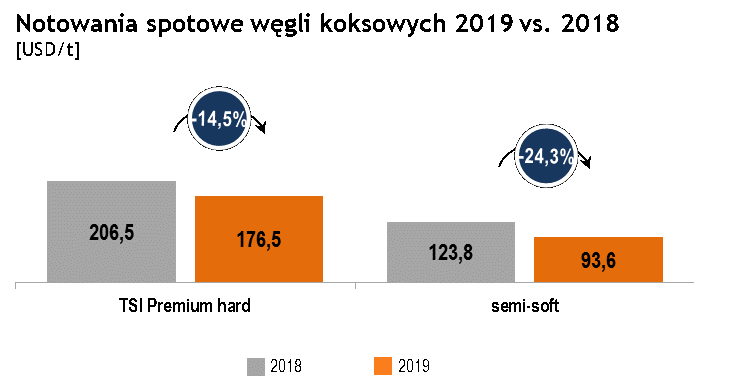
Chart. Steel prices on the European market [USD / t]
Metallurgical (coking) coal market
The metallurgical (coking) coal market is global. The prices of seaborne metallurgical (coking) coal are shaped mainly by relations between Australian suppliers and Asian customers. JSW Group sets coal prices based on price indexes, taking into account the quality differences between the Group's coals and index coals as well as its geographical advantage. Approx. 1.2 billion tonnes of metallurgical coal (HCC, semi-soft, PCI) is consumed globally every year. With an 80% share, Asia is the largest consumer. EU member states account for approx. 6% of the global consumption of this raw material.
In 2020, the prices of metallurgical (coking) coals were driven by the fallout from the COVID-19 pandemic in the form of an economic slump and thus a decline in demand for steel and the raw materials used to produce steel. This is why the spot prices of metallurgical (coking) coals declined the most in the second quarter of 2020. The prices stabilised at a low level in the third quarter, with weak demand for steel and large-scale stoppages in steelmaking capacities. The end of the third quarter and the fourth quarter of 2020 were a period of economic recovery, higher demand for steel and the re-start of the previously halted blast furnaces. Record steel production levels in China as well as recovery in India and Europe supported growth in the prices of metallurgical (coking) coals. The growth trend was halted in October when China made the decision to block Australian coal imports, which had a direct impact on their spot prices. These changes in the spot prices of metallurgical (coking) coals throughout the year meant that the average daily price for the TSI Premium HCC index in full-year 2020 was 124 USD/t and was 29.7% lower than in the preceding year. Semi-soft coals recorded smaller declines than hard premium coals, with the 2020 annual price average being 26% lower than in the previous year.
Chart. Coking coal spot quotation
The following diagrams show the average prices for metallurgical (coking) coal sold by the Group to external customers, converted into USD using the average exchange rate published by the National Bank of Poland for each quarter, in relation to the TSI index and a benchmark price calculated using Nippon Steel's methodology.
Chart. JSW's metallurgical coal (coke) price in relation to quotations
Chart. Relationships between JSW's metallurgical coal (coke) prices and quotations
Thermal coal marke
According to data from Polskie Sieci Elektroenergetyczne, the volume of electricity generated in industrial-scale power plants declined. In the period January-December 2020, this decline came to 6.04% in comparison with 2019. Hard coal (-8.5%) and lignite recorded the largest declines. Wind- and gas-based power plants recorded growth. Mines producing thermal coal recorded further inventory increases during the year.
In 2020, the PSCMI1 index, depicting thermal coal prices in sales to domestic utility and industrial power plants, increased by more than 1.6% from 2019. In contrast to domestic increases in prices, the average annual price for pulverised coal imported by sea to Western and Northern European countries through ARA ports (Amsterdam, Rotterdam, Antwerp) declined by under 17% in 2020 to 50.0 USD/t.
The following chart presents the relation between the quarterly prices for thermal coal sold by the Group and the PSCMI1 index.
Chart. JSW steam coal prices in relation to the PSCMI 1 quotation [PLN / t]
Coke market
Just as in the case of coking coal, the coke market is global. Demand for coke largely depends on the level of steel production in the basic oxygen furnace process (BOF), which currently accounts for approx. 70% of global steel production. Nearly 30% of global steel output comes from electric arc furnaces (EAF). Other processes, such as direct reduced iron, account for a marginal part of total output. In China, nearly 90% of steel is produced in blast furnaces, while in the EU this figure is 58.7%, below the global average (2019 data).
Poland is a leading external supplier of coke in the EU. Because the coke market is global, coke from Poland competes with coke supplies not just from Europe but from all over the world, including China, Russia and Colombia. Prices for blast-furnace coke on the European market averaged 238.75 USD/mt CIF ARA in 2020, denoting a 26% decline in comparison to 323.33 USD/mt CIF ARA in 2019.
In 2020, the relation between the price of blast-furnace coke on the European market and contract prices for hard premium coking coal remained in a range considered as essential conditions for the efficient operation of coking plants.
The difficult situation on the steel and metallurgical (coking) coal markets in 2020 was accompanied by structural changes on the coke market. China - as the market that recovered the fastest and saw the highest demand for coking (metallurgical) coal and coke - in the second half of 2020 went from being a net exporter to net importer of coke. Excess coke in other regions was allocated to China, changing the destinations for this raw material and giving rise to price mechanisms that are different from the rest of the world. As a result of the aforementioned factors, coke prices on the Chinese market were considerably higher than prices in other regions of the world.
Coke production in China reached 471 mt in 2020, which constitutes more than 70% of global coke production. This is the same level as China had recorded in the preceding year.
CRU estimates that the global coke trade reached 25.6 million tonnes in 2020, a 14% decline from the preceding year. Coke exports from China in 2020 reached 3.5 mt, down by 47% from the previous year. The decline in coke exports from China is due to its loss of pricing competitiveness in comparison with other sources of this commodity and China's internal demand for coke due to an insufficient domestic supply. At the same time, coke imports to China reached 3 mt in 2020, an eightfold increase in comparison with 2019. The main suppliers of coke to China in 2020 were Japan (1.2 Mt), Australia (0.37 Mt) and Poland (0.31 Mt). The following diagrams depicts the relations between average quarterly prices for coke based on FCA, converted into USD using the average exchange rate published by the National Bank of Poland for each quarter, and prices for blast-furnace coke on the European market and Chinese coke.
Chart. JSW coke prices in relation to quotations [USD / t]