Shortcuts


The domestic and international coal and coke markets are subject to a number of factors remaining beyond the Group’s control. In 2012, in particular in the second half of the year, the markets for coal, coke and steel were affected by economic slowdown which resulted in lower production, increased inventories and a reduced capacity utilization rate of coking plants. In the coking coal – coke – steel supply chain, lower demand for steel translated into a decrease in prices and revenues on sales of coke and coking coal. This was particularly noticeable in the European market as crude steel production in the European Union in Q3 2012 was over 10% lower than in Q2 2012, and 2% lower in Q4 2012 than in Q3 2012. In 2012, steel production in the EU (27) countries was 169.4 million tons, i.e. 4.7% less than in the same period of the previous year. With the exception of the crisis year 2009, it was the worst result in the past decade. Apparent consumption of steel in Europe in 2012 compared to 2011 decreased by 8%. Compared to 2007, the decrease was almost 30%. The only region which experienced a significant increase in steel production in 2012 was Asia, including China. The other regions recorded lower output. The world’s crude steel production capacity utilization rate kept declining in H2 2012 (July: 79.4%, September: 77.7%, December: 73.2%). In Europe, almost a third of all blast furnaces installed were shut down. The situation in the steel market significantly affected the coke market. The sales of coke in the global markets declined from 21.7 million tons in 2011 to approximately 18 million tons in 2012. In Poland, coke production in 2012 was approximately 8.6 million tons, i.e. 6.1% lower than in 2011. Exports from Polish coking plants decreased by 7% to approximately 5.4 million tons. A significant decrease in demand for coke translated into a deeper-than-expected drop in prices. For instance, in November 2012 the price of blast furnace coke in the European market averaged USD 270 per ton based on CFR Northern Europe and was USD 135 per ton (33%) lower than in November 2011. The economic slowdown in Europe also affected the foundry coke market. The decrease in sales in the automotive industry, which is the main recipient of foundry coke, by 6.2% compared to 2011 resulted in reduced orders and falling prices. In 2012, part of the interest in heating coke shifted toward coal, eco-pea coal, other biofuels and industrial coke, which is also exposed to economic cycle fluctuations. The situation in the coking coal market was similar. In Q4 2012, the benchmark price of coking coal decreased by USD 115 per ton (40%) compared to Q4 2011. A similar situation was observed in the coking coal spot market where the price in November 2012 was USD 102 per ton lower than in November 2011.
The prices of coke and coking coal offered by the Group followed the market trends, as illustrated in the following charts.
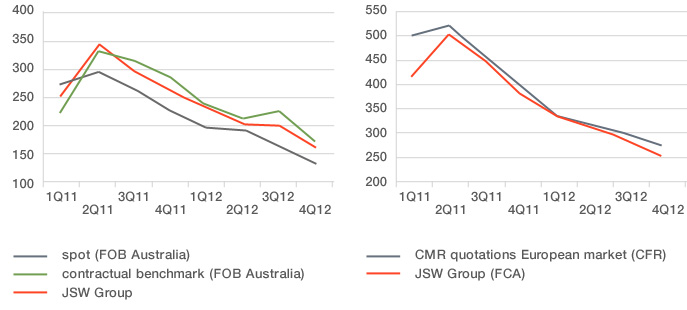
At the end of year, the downward trend in spot prices stopped, which favorably affected the mood for 2013 forecasts.
In 2012, despite the unfavorable market environment, not only did the Group manage to maintain the volume of deliveries to its existing customers, but also established cooperation with new trading partners. The difficult market situation had a significant impact on the revenues generated from the sale of the Group’s products, realized at PLN 8,821.0 million, i.e. PLN 555.8 million less than in 2011.
Revenues on external sales of coal, coke, coal derivatives and other operations of the Group, broken down by geographic area and by buyer, are presented in the table below.
| Item | 2012 | 2011 | Growth | ||
|---|---|---|---|---|---|
| Value | Share | Value | Share | ||
| Total sales revenues in the Group (in PLN millions), including: | 8,821.0 | 100.0% | 9,376.8 | 100.0% | 94.1% |
| Coal | 4,134.9 | 46.9% | 4,943.3 | 52.7% | 83.6% |
| - Poland | 3,134.1 | 35.5% | 3,876.7 | 41.3% | 80.8% |
| - EU countries | 785.1 | 8.9% | 1,066.6 | 11.4% | 73.6% |
| - Other countries | 215.7 | 2.5% | - | - | - |
| Coke* | 4,307.9 | 48.8% | 4,220.0 | 45.0% | 102.1% |
| - Poland | 883.6 | 10.0% | 934 | 9.9% | 94.6% |
| - EU countries | 2,711.6 | 30.7% | 2,885.8 | 30.8% | 94.0% |
| - Other countries | 712.7 | 8.1% | 400.2 | 4.3% | 178.1% |
| Other operations | 378.2 | 4.3% | 213.5 | 2.3% | 177.1% |
* This item includes revenues on sales of coke and coal derivatives.
In 2012, the share of revenues on sales of coal to 5 main external customers was 77.5% of total revenues in this segment. Other buyers, whose unit share did not exceed 10% of revenues, generated the remaining 22.5% of total revenues of the coal segment. In turn, the share of revenues on sales of coke to 5 main customers was 62.3% of total revenues in this segment. Other buyers whose unit share did not exceed 10% of revenues, generated the remaining 37.7% of total revenues of the coke segment.
 download table